The interface allows the user to analyze data sent from the systems.
To do so, right click on a system and select from the context menu “Show data” and the desired timespan.
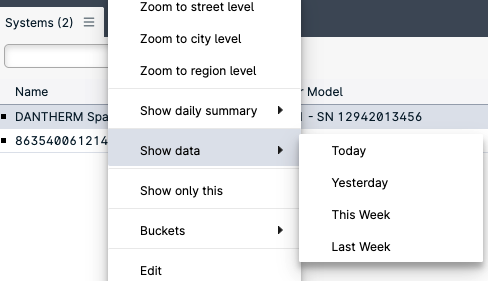
A new panel will show up in the interface listing al the transmissions from the selected system.
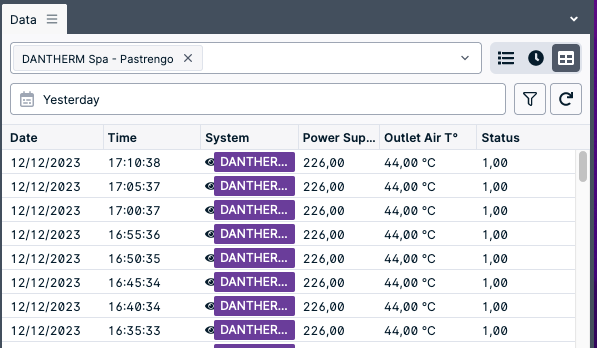
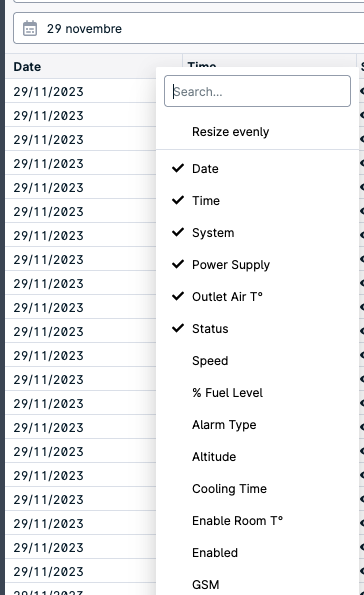
The user can select different system variables to be analyzed by right clicking on the header of the table in the Data panel.
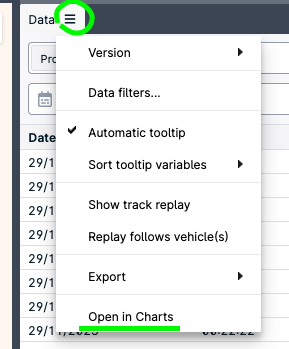
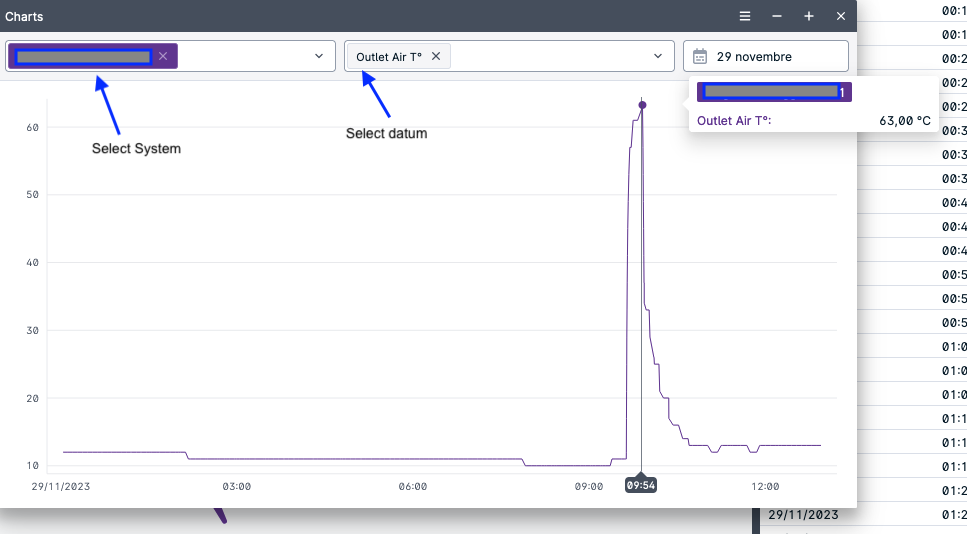
Additionally the user can left click on the three lines near the label “Data” of the data panel to show additional options and select “Open in Charts” to open the chart panel