Categories
User interface

Heater parameters settings

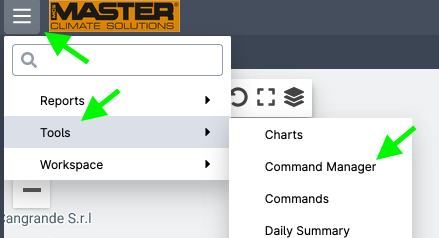
Several heater parameters can be controlled using the Command Manager tool.

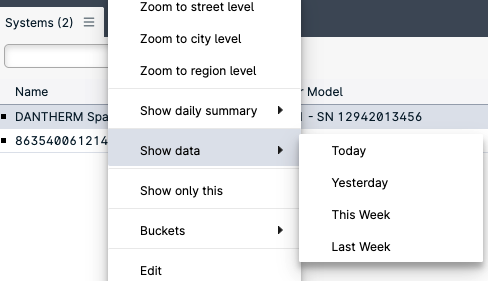
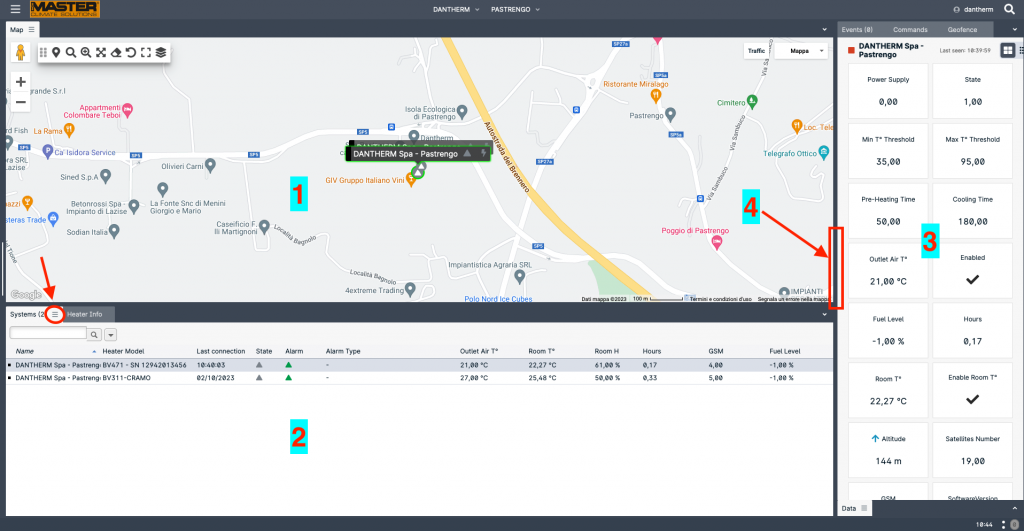
If you have multiple heaters, you can simplify the search by selecting the appropriate ‘Tag’ (i.e., group) and using the ‘search’ textbox. Then select the desired heater(s).

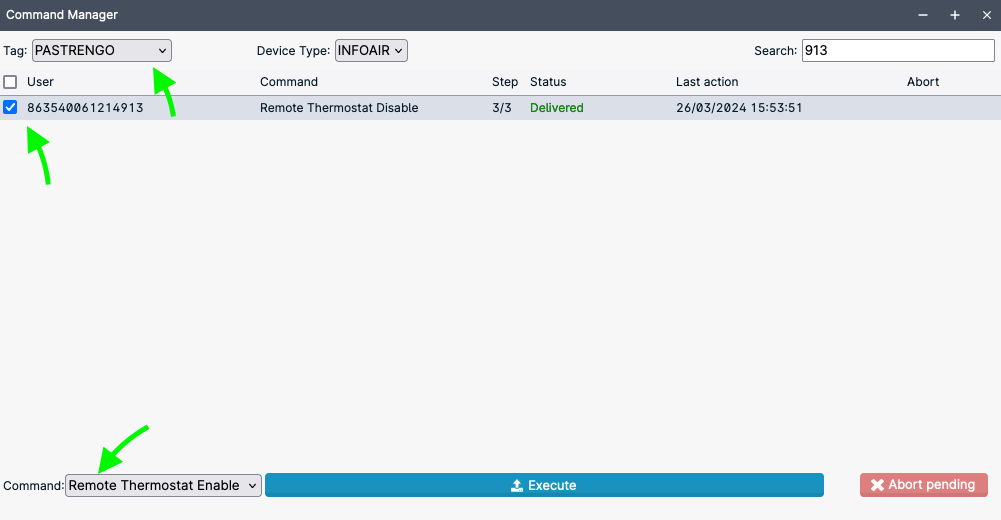
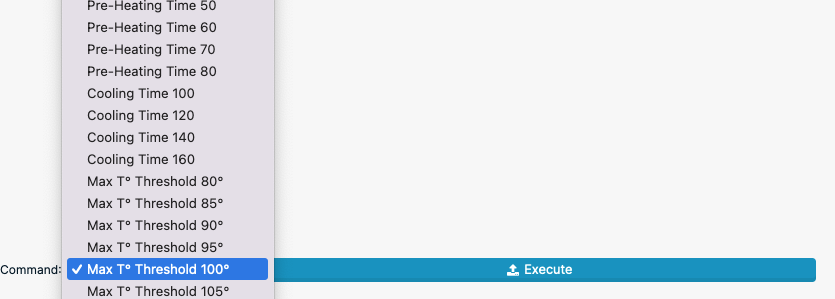
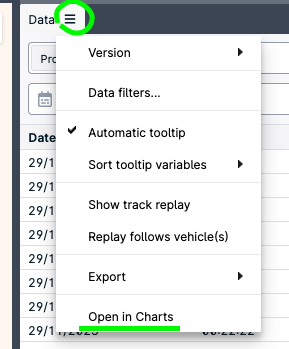
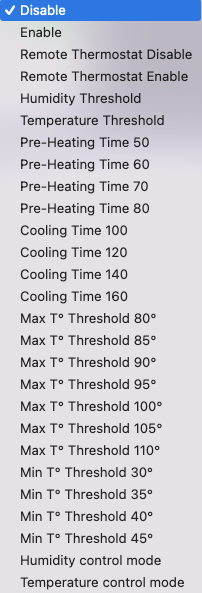
Open the Command combobox and select the desired command:

Once the desired parameter has been selected, click the Execute button to send it to the heater.

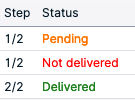
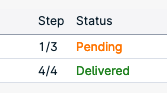
The system is designed to account for network disconnections so it will keep trying for several minutes, in case the command cannot be delivered, its status will be shown as “Not delivered”. In this case you can send the command again. A “Pending” command is being executed or is waiting for the device to connect.

Even though the system allows sending multiple commands and queue them, we strongly recommend to wait the completion of a command before sending the following. Before sending a new command, check there is no pending command.

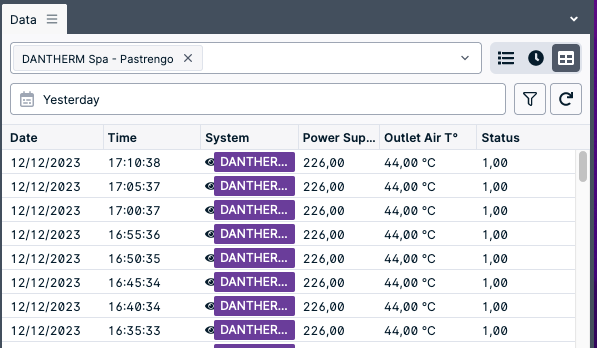
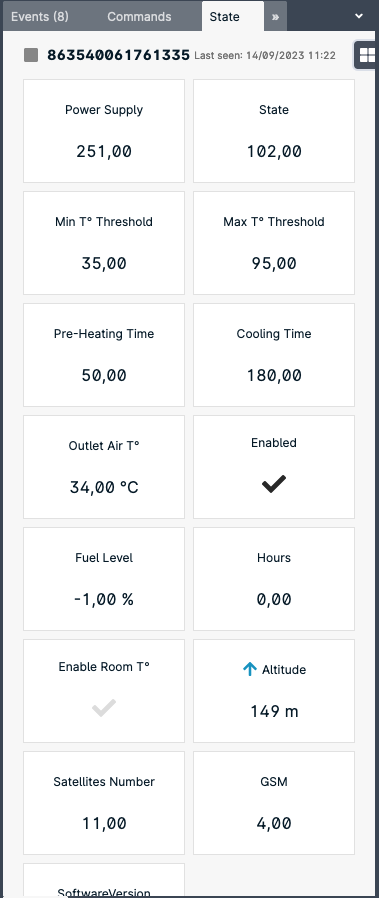
Once the command will have been executed the appropriate parameter in the Status panel will change accordingly.


For instance, to set up the MAX OAT threshold, which is the temperature at which the ventilator will stop, select the appropriate value from the dropdown list, and then click Execute

Categories
User interface

Data analysis

The interface allows the user to analyze data sent from the systems.

To do so, right click on a system and select from the context menu “Show data” and the desired timespan.

A new panel will show up in the interface listing al the transmissions from the selected system.

The user can select different system variables to be analyzed by right clicking on the header of the table in the Data panel.

Additionally the user can left click on the three lines near the label “Data” of the data panel to show additional options and select “Open in Charts” to open the chart panel

Categories
User interface

Status Icons

In the map the system status is also displayed throughout a position marker and a set of icons (status indicator), each having a specific meaning.

Each system on the map is shown with a position marker and a series of status indicators:

The position marker can change in any of the following icons:

The System is disabled
The system is powered on with no alarms
The system is powered on with alarms
The system is powered off


Status indicators are display simultaneously.

The first indicator displayed is always the same as the marker indicator.

If the fuel level sensor is installed, an additional indicator can be displayed with the following meaning:

Fuel level below or equal to 10%

Fuel level below or equal to 25%

The last indicator displays the heater power status.

Heater powered on

Heater powered off

Example of Heater: disabled, low fuel and powered on

Categories
User interface

State panel

The state panel shows the parameter of the system currently selected in the “Systems” panel. To select a system just click it (mouse left button) in the System panel.

  • Power Supply: Main AC supply
  • State: heater state code
  • Min T° Threshold
  • Max T° Threshold
  • Pre-Heating Time
  • Cooling Time
  • Outlet Air T°
  • Enabled: Whether the heater is enabled or disable. By disabling the heater the heater will stop working until enabled again.
  • Enable Room T°: when the flag is dark, an external BLE temperature sensor is associated with the heater.
  • Satellite Number: Number of GPS satellites tracked.
  • GSM: Cellular network signal quality (1: poor – 5: excellent)

The parameters reported in the panel refer to the system name reported on top of the list.

Categories
User interface

User Interface

The user interface is designed and tested to work best with Google Chorme ®. Alternatively also Firefox is reported to work well.

The user interface is composed by several panels, each carrying a specific piece of information.

(1) Map area with all the available systems in the current view. Each system is located in the last known position and with its status indicators.

(2) List of all the systems available in the current view, including the main parameters, such as room temperature, alarm, last connection, etc.

(3) Status of the selected system. All the parameter in this panel are related to the system selected in the Systems panel (2). To select a system just click it (mouse left button)

Each panel is identified by a label (Map, Systems, Heater Info, Commands…). If a three horizontal line icon is present near the label, additional options are available:

Panels (also called “tabs”) can be move around the interface in order to setup your own work space. To move a panel hold the mouse left button on the panel label and wait until the interface changes into edit mode and, still holding the mouse, position on the green lines:

To resize panels, move the cursor on the panel edge (4) and then drag as desired.

Once the interface is setup according to your needs, save your worksapce:

To change language or password select the user setting from the top right corner.